

Blog
A Beginner’s Guide to Reading Your Own Financial Patterns
You open your finance app. You see a number. You close the app. Nothing changes.
Tracking shows you totals. It doesn’t show you patterns — and patterns are where your money actually leaks. This guide shows you how to read yours in about ten minutes a month.
Many people use personal finance applications to track their finances, but still miss the signals that these solutions are hinting.
Tracking your spending is just the first step. The real value comes from understanding what your data actually means.
This guide will show you how to make sense of your financial patterns, and you don’t need any accounting background. By the end, you’ll know what to look for, what your numbers are telling you, and what steps to take next.
First: What is a financial pattern?
A financial pattern is simply a habit that shows up in your money. It’s the coffee shop you visit every weekday. The subscriptions you forgot you had. The fact that you always spend more in the last week of the month when you’re stressed.
Patterns aren’t good or bad on their own. They’re information. And once you can see them clearly, you can decide which ones to keep, which to change, and which ones are quietly draining your finances without you realizing.
Start with the big picture: Income vs. Expenses.
Before diving into individual transactions, zoom out. The first question to ask is simple: Am I spending more than I earn?
Many income tracking applications provide a summary of income and expenses. For example, in Trakli ( a private and transparent income tracker), the home dashboard shows a snapshot of your total income and total expenses for any period you choose. Look at this view and ask yourself three things:
- Is the gap between income and expenses growing or shrinking month to month?
- Are there months I spent significantly more, and why?
- Is my income consistent, or does it vary a lot?
These three questions alone will tell you more about your financial health than any single transaction ever could.
Trakli tip 💡
Use Trakli’s date filter to compare the same month across two different years. This is one of the fastest ways to spot whether your financial habits are improving over time.
Understand your spending categories.
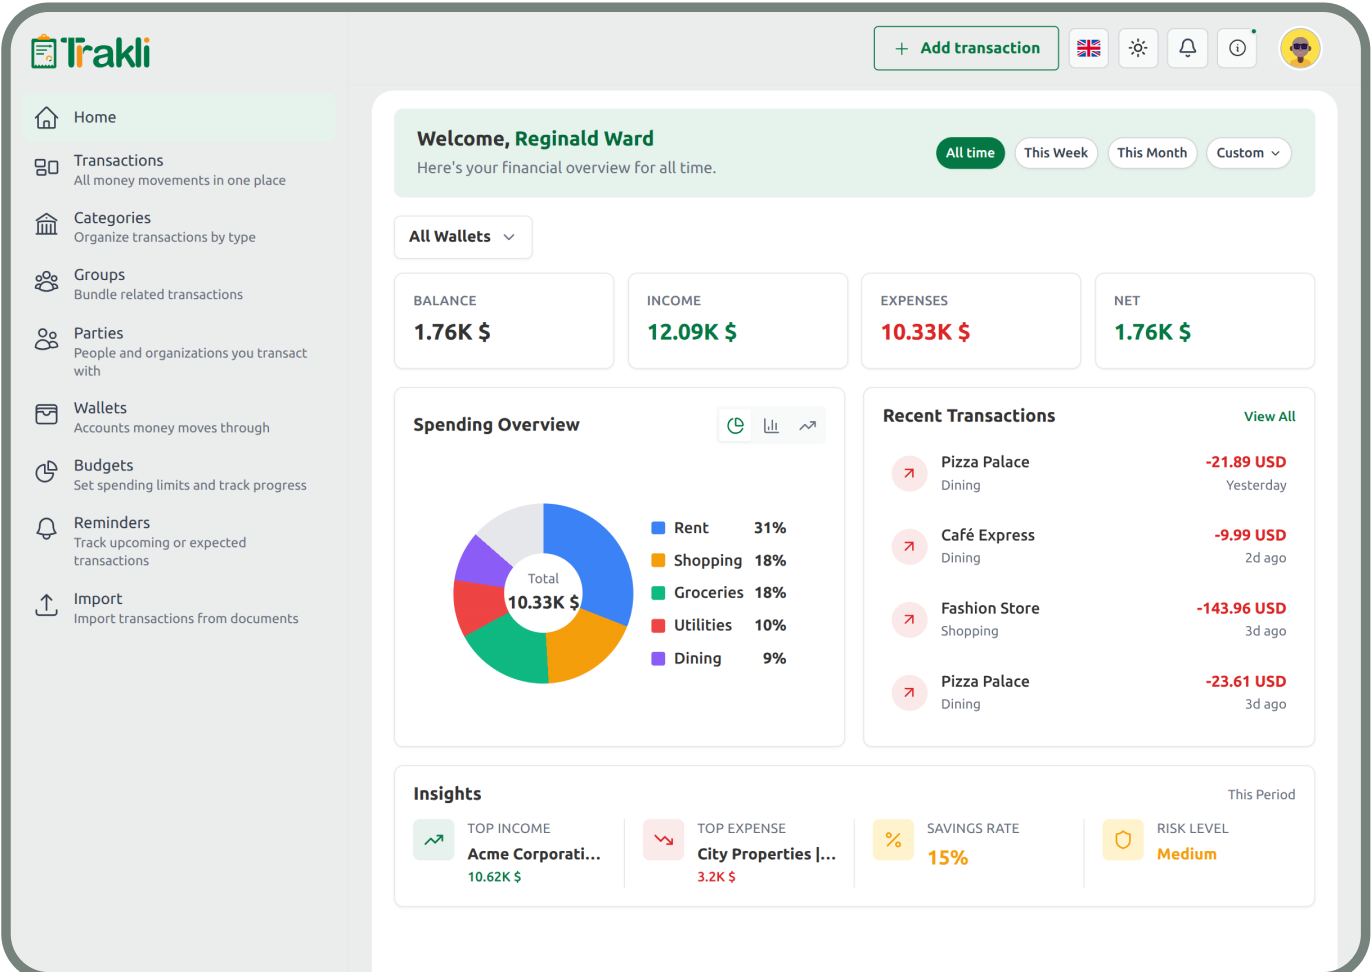
Once you understand the big picture, take a closer look. Trakli’s category breakdown, shown in the pie chart on the Statistics screen, splits your spending into categories such as food, transport, bills, entertainment, and more.
Here’s how to read it:
Look for your biggest slice
Whatever category takes up the most space in your chart deserves your attention first. This doesn’t mean you’re overspending there. Some things, like rent, are meant to be your biggest cost. But knowing what it is gives you a foundation to build on.
Look for surprises
Is there a category that’s bigger than you expected? This is where most people have their first real moment of financial clarity. Takeout food. Impulse shopping. Ride-hailing. These categories often quietly become major expenses without ever feeling that way in the moment.
Look for categories that are growing.
If a category accounts for 15% of your spending this month but only 8% last month, it deserves a closer look. Growth in a spending category isn’t always bad, but it should always be intentional.
Read your transaction history like a story.
Your transaction list is more than just a record; it’s a timeline of your decisions. When you scroll through it slowly and honestly, you see your own habits.
Try this exercise: filter your transactions for the last 30 days and scroll through them. For each one, ask: was this planned or impulsive? Did it bring me value? Would I make this same choice again?
You don’t need to judge yourself. You just need to be honest. The goal is to see the difference between the spending you chose and the spending that just happened.
Spot your spending triggers
One of the most powerful things you can learn from your financial data is not just what you spend money on, but also when and why.
Common spending triggers include:
- Stress or bad days (emotional spending)
- Weekends and social occasions
- Pay day (the ‘I deserve this’ effect)
- Sales and discount seasons
In Trakli, you can use the date filter to look at specific days of the week or times of the month. Do you consistently spend more on Fridays? In the last five days before payday? These patterns are your triggers, and knowing them is the first step to managing them.
The difference between fixed and variable expenses
Once you understand your categories, it helps to separate your spending into two types:
- Fixed expenses: These stays the same every month, like rent, loan repayments, insurance, and subscriptions.
- Variable expenses: These changes from month to month, such as groceries, entertainment, transport, and personal care.
This distinction matters because you have limited control over fixed expenses in the short term. Variable expenses, however, are where your real financial decisions happen. When you want to save more, variable expenses are the best place to start.
Trakli tip 💡
Create custom categories in Trakli to separate your fixed and variable expenses. Label them clearly. This one habit alone can transform how clearly you see your financial picture each month.
Set one goal based on what you find
Reading your financial patterns is only helpful if it leads to action. But the action doesn’t have to be dramatic. In fact, small, specific changes are almost always better than big, vague ones.
After reviewing your data, pick just one thing to change. Not five. Not a complete lifestyle overhaul. One.
Examples of good one-thing goals:
- I’ll reduce my takeout spending by 30% this month.
- I’ll cancel the two subscriptions I haven’t used in 3 months.
- I’ll set aside 10% of my income every payday before spending anything.
Track it for 30 days. Look at your Trakli data at the end of the month. See if it moved. Then set the next goal.
Your data is already working for you.
Most people think financial progress requires a big salary, or a financial advisor, or some secret knowledge they don’t have.
It doesn’t. It requires clarity. And clarity comes from understanding your own patterns.
Every transaction you’ve recorded in Trakli is a data point. Together, they tell the story of your financial life so far. What you do next will shape the next chapter.
Start there. The numbers are already on your side.
Ready to start reading your own financial patterns?
Trakli is a free, private, and open-source personal finance tracker that works on any device, even offline. Sign up at trakli.app and see your financial patterns for the first time.